 Glacier Park Chat

First, some disclaimers:
- All data comes from nps.gov, what an amazing and likely unheralded job they do collecting and providing this information.
- Focus on last 10 years - felt like this was a relatively good range
- Covid 2020 and Howe Ridge Fire 2018 cut the road, as well as campground limitations in 2021
- Unknown how many Going to the Sun Road tickets were available per day (what was the target throttling level)
- Unknown how many people were turned away at the gate (potential visitors) as well as those that never came in the first place dude to lack of ticket, but perhaps those could be inferred by other areas increases and total visitation figures respectively
- Data is only available monthly, so August has been my month of focus, as a late Going to the Sun Road opening will heavily influence July numbers. This also doesn't allow for the granularity to see a shift from non-Going to the Sun Road areas to Going to the Sun Road once it opens.
- The park has sensors at each entrance that scan traffic - 24/7.
- Each vehicle is assumed to carry 2.9 people with a 7% deduct for non-recreational visitors
- Each campsite is assumed to have 2.5 people, or 3 people if an RV site
- Backcountry is based on actual people

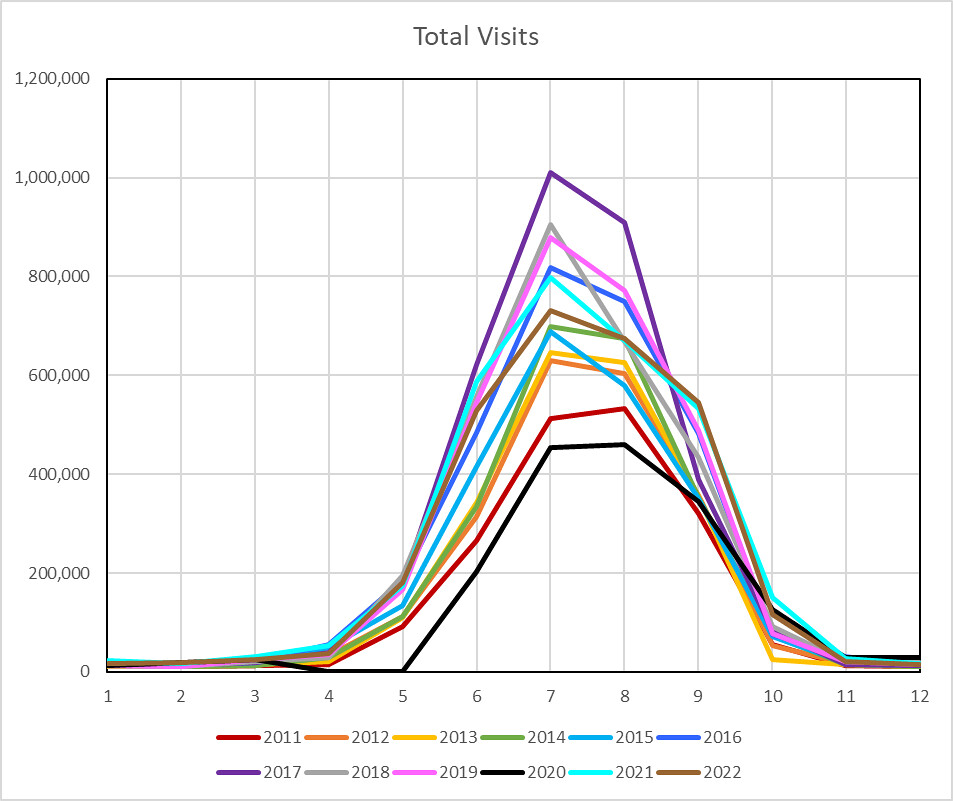
The first observation I had is that yes indeed there has been an increase in people visiting the park recently, but this really started around 2016, and has actually decreased since. I checked the 'counting procedure' documents and they didn't change in function (new document came out in 2017, but had the same factors).
So the park is averaging around 3 million visitors per year now. When do they arrive? Pretty much as expected June-September, with last two years seeing an increase in September while being lower June-August.
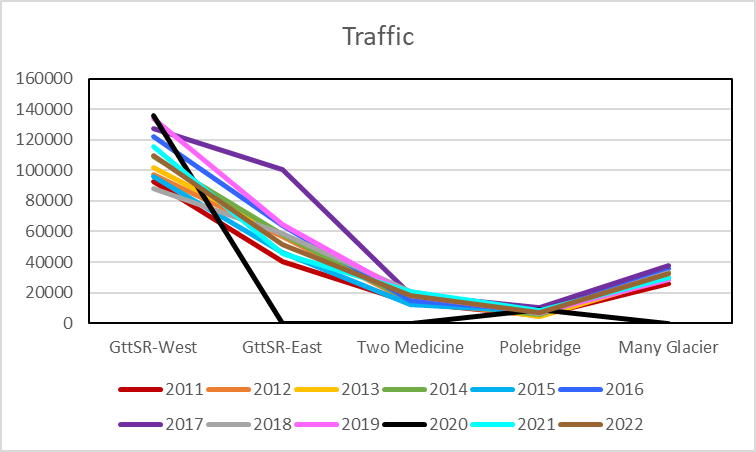
Where are they entering the park? As expected, mainly going to the sun road. Here one can see the 2017 east entrance outlier - I think this is an error. The takeaway is that the 'other 3' (Polebridge, Many Glacier, Two Medicine) add up to about the east entrance, which the west is 2.5x larger than.
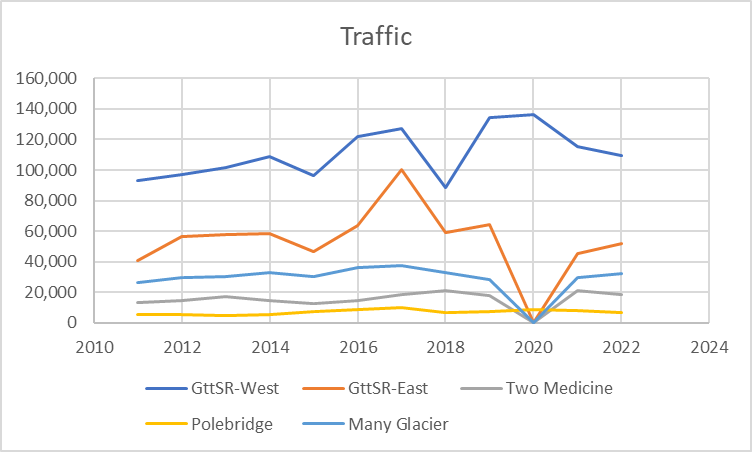
This means that a small diversion from Going to the Sun due to access (tickets, road closed, or otherwise) is going to have a large impact on the 'other 3'. Here is a look at August yearly traffic, where the drop from previous highs can be seen on Going to the Sun Road, while the 'other 3' are so small in magnitude it is hard to assess.
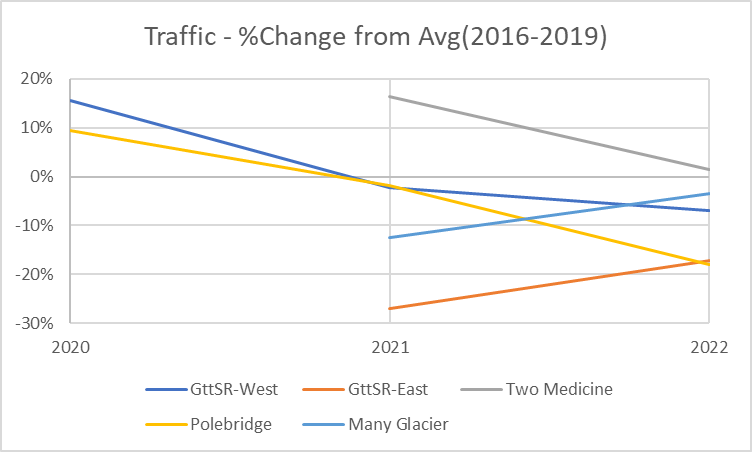
So I took a deeper dive into the 'other 3'. What I did is average the numbers from 2016-2019 and took the difference from the measured values each year 2020-2022. Yes, this is cherrypicking the 'high years', but the park survived then so I thought that would be a good benchmark. I didn't include 2017 for the East entrance because oft the anomaly.
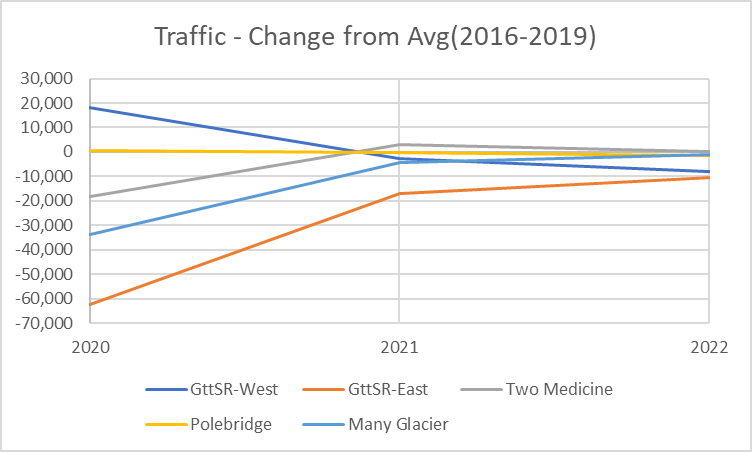
As well as a percentage basis, which is probably more meaningful from a capacity standpoint. Result here is that Many Glacier and Polebridge went down, without ticket system, and with potential non-ticketed overflow from Going to the Sun Road. Two medicine did see a big increase in 2021, but it reduced closer to average in 2022. Polebridge saw a big increase in 2020, but receded as well to below average in 2021 and 2022. This also shows Going to the Sun Road is
One other item of interest is camping. Once campers are in the park, unless they leave then they wouldn't be counted each day, but would be tying up resources (road, parking, trails, etc). During August, there were about 5500 people per day entering from the east and west combined. There are about 2500 front country campground people capacity, so the overcrowding isn't just the people at the gate, but the people inside as well. To that end, the front country wasn't fully open until 2022, so the utilization of the park was even lower in 2020 and 2021 than the entrance numbers would indicate compared to the averages. 2022 numbers weren't provided on the site, but hopefully those are closer to the 75,000/month capacity (2500 x 30).

And finally, not pertinent to this discussion, but my personal interest, so here are the backcountry numbers. There are 141 camp sites, so 564 people / day max, or 16,920 per month. Numbers below this don't necessarily imply no-shows, as actual camper numbers are used (could be less than 4 per site) and not all sites are necessarily reserved and/or permitted, but interesting nevertheless. One trend is the increased usage in September. Again no 2022 data, but 2021 is appreciably lower than the trend, with 2020 to be ignored as the east side wasn't open.


